I delved into some 5-man lineup statistics courtesy of NBA.com, with the aim of discovering if the most successful combinations have played the most games and minutes together. Then, I compared the plus/minus rating of those lineups to their corresponding traditional statistical categories, in hopes of finding what drives a successful group on the floor. Feel free to post your own impressions from the data in the comments section.
I trimmed down the lineup combinations and (hopefully) removed small sample size bias by excluding any that have appeared in less than 4 games this season, and have played less than 3 minutes per contest. 23 5-man lineups made the cut.
ARE THEY PLAYING ENOUGH?
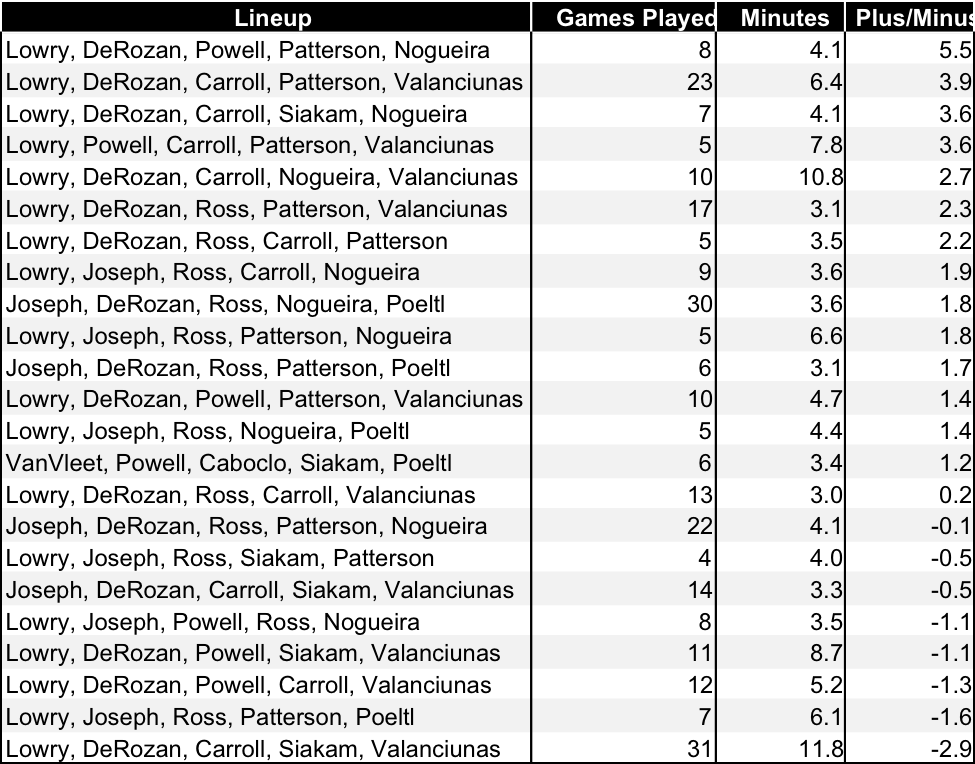
The first worrying conclusion is hard to miss – far and away the team’s most used lineup (31 games and 11.8 minutes per game) happens to have the team’s worst plus/minus so far this season at -2.9. This was the starting group for some time, with Kyle, DeMar, DeMarre, Pascal and Jonas. This highlights the reason for Casey’s mid-season change, even going so far as putting his eternal sixth man in the starting five at one point. Ibaka’s acquisition here is of paramount importance, as his insertion into the starting group should immeasurably improve the output of that team-worst lineup.
Meanwhile, the club’s most efficient lineup at +5.5 of Lowry, DeRozan, Powell, Patterson and Nogueira was used in only 8 contests and only 4.1 minutes in those games (13th most used in both categories). It’s the team’s best iteration by a wide margin (1.6), leading to the question of why it doesn’t figure more prominently.

While DeRozan and Lowry appear in many of the lineups due to their high minute count, it’s worth noting Patterson features in 3 of the team’s 4 best plus/minus lineups, while showing up in only one of the bottom 5. Carroll may surprise some as well, showing up in 4 of the team’s top 5 lineups, and in only 2 of the bottom 5.

The graphs appear to show no significant correlation between games played/minutes as compared to plus/minus. This can point to a number of things, but chief among them is that the best lineups do not necessarily get the most minutes.
Assists

General Lowry features in all top 11 of the team’s most assist-happy groups, while being nowhere to be seen in the bottom 3, lending further credence to his team engine status. In other predictable news, DeRozan can be found in all of the bottom 3 groups, while showing up in only 2 of the top 5. But does the increase in assist output manifest itself on the scoreboard?
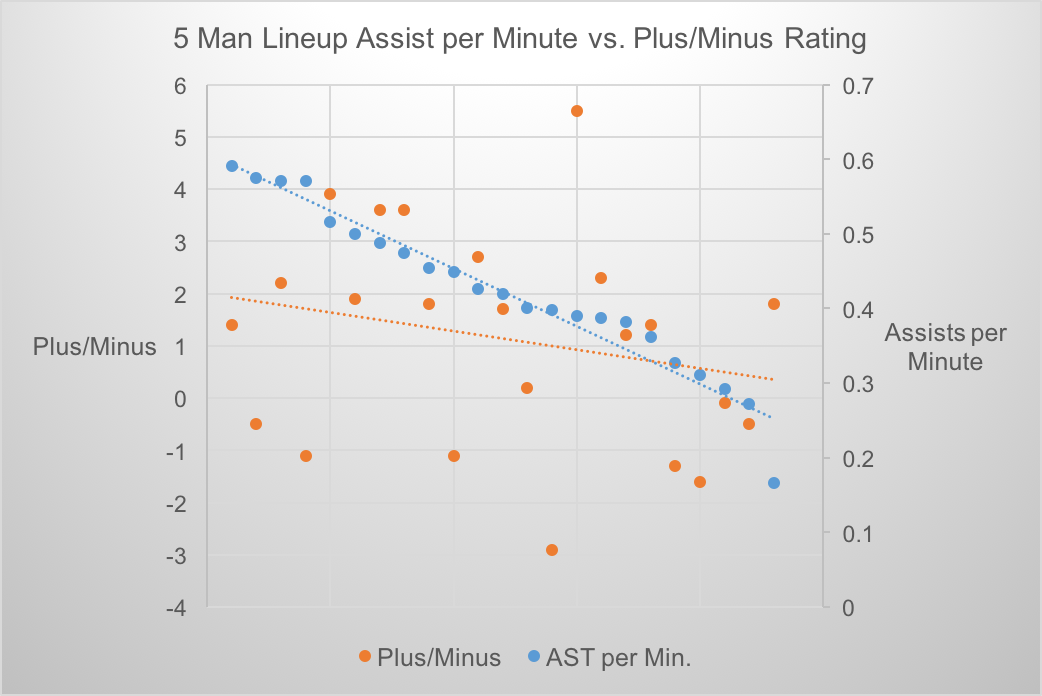
Kind of, but not really. Two of the top 5 groups in assists per minute (both without DeRozan, in fact) post a negative plus minus, though things even out a bit the rest of the way.
Shooting Percentages
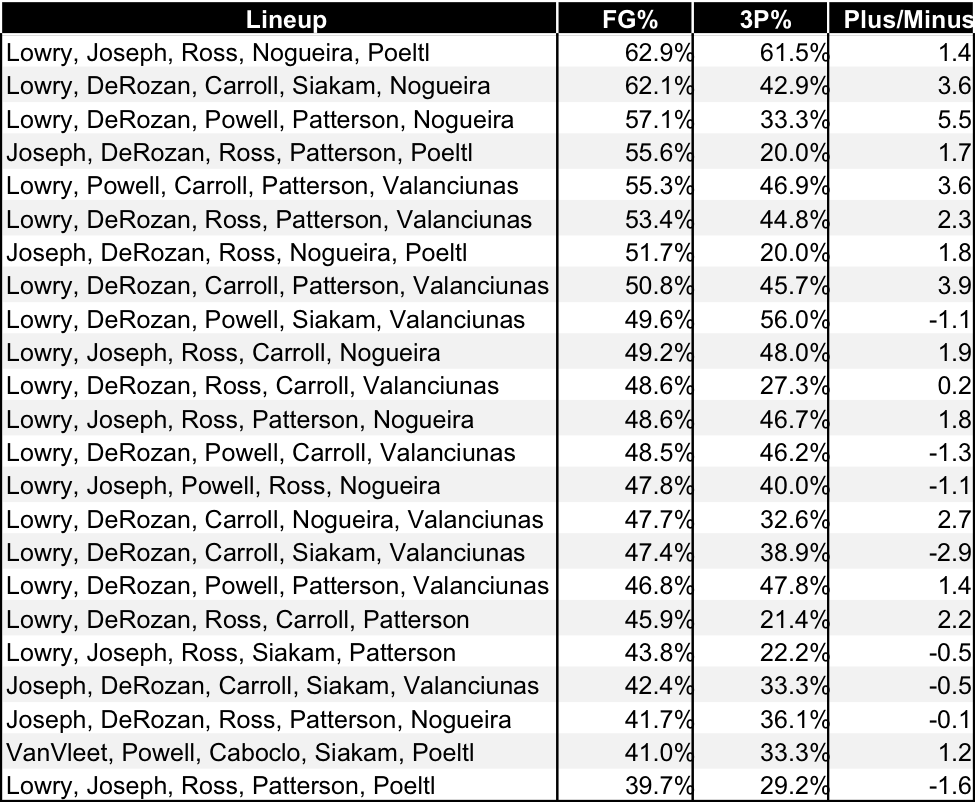
Here we can see the strongest correlation yet. It makes sense though, considering one needs to put the ball in the basket in order to win a game. Still, some nuggets of information can be gleaned from this.
Lowry and Nogueira (that alley oop combo can’t hurt) appear in all 3 of the team’s top 3 field goal percentage lineups, while DeRozan is in 2 of the 3. Three of the team’s best plus/minus lineups feature in the top 5 of the category as well. Disappointingly, Canada’s own Cory Joseph is in 3 of the bottom 4 lineups for field goal percentage (or all 3, if the surprisingly-heavily-used garbage time group of VanVleet, Powell, Caboclo, Siakam and Poeltl is excluded).
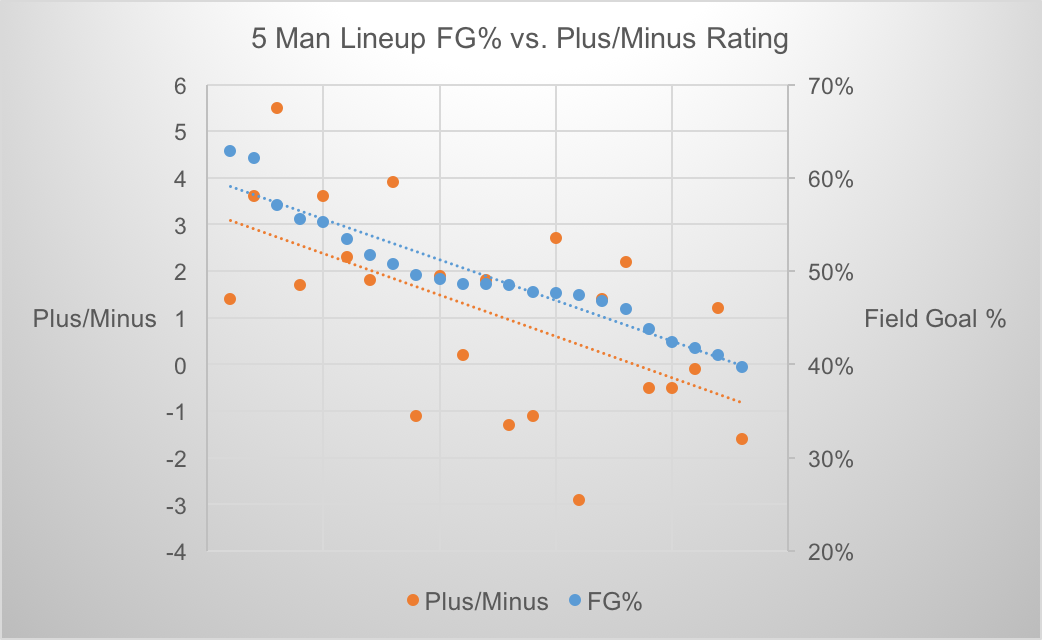
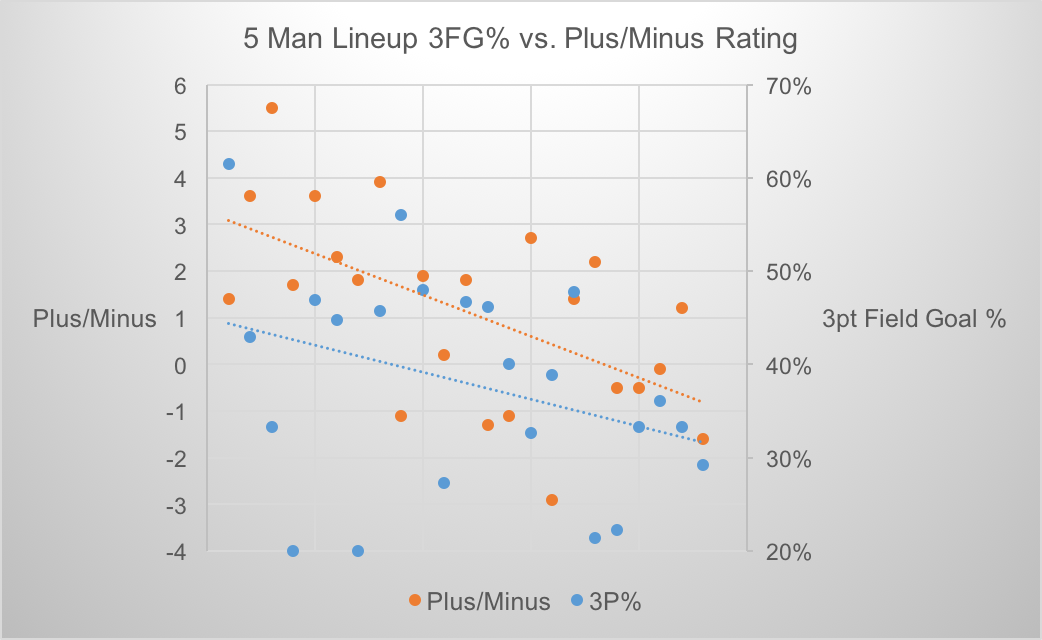
The correlation in shooting percentages to plus/minus indicates the importance of two main things – having quality shooters (I hear Masai is working on another trade) and creating open looks. The Chicken or the egg…
Steals
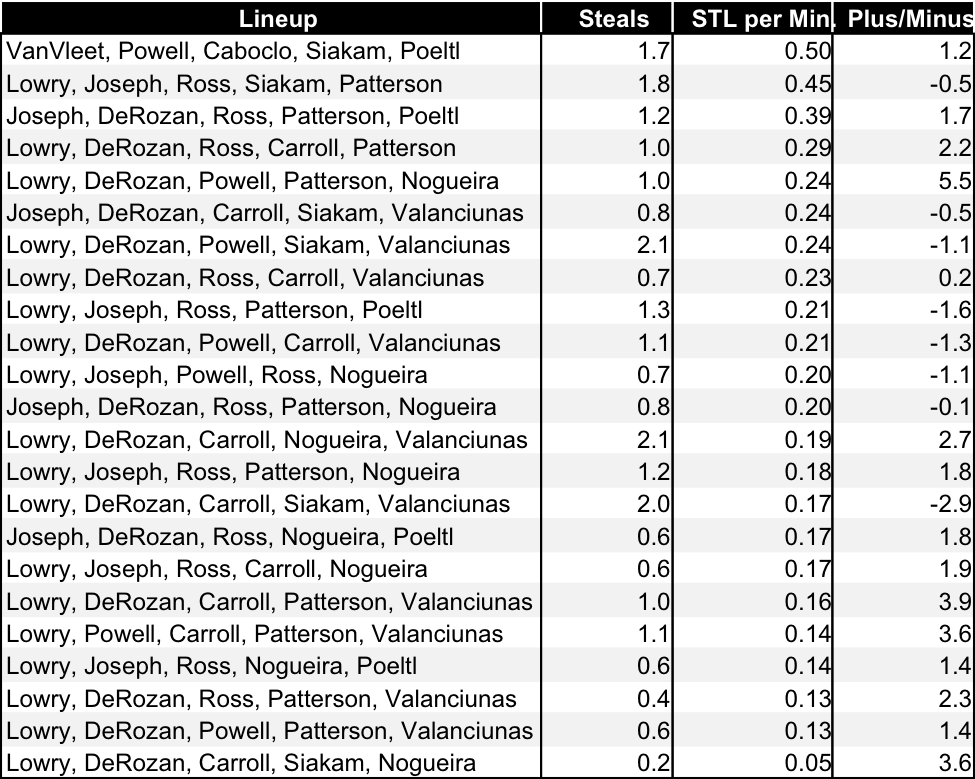
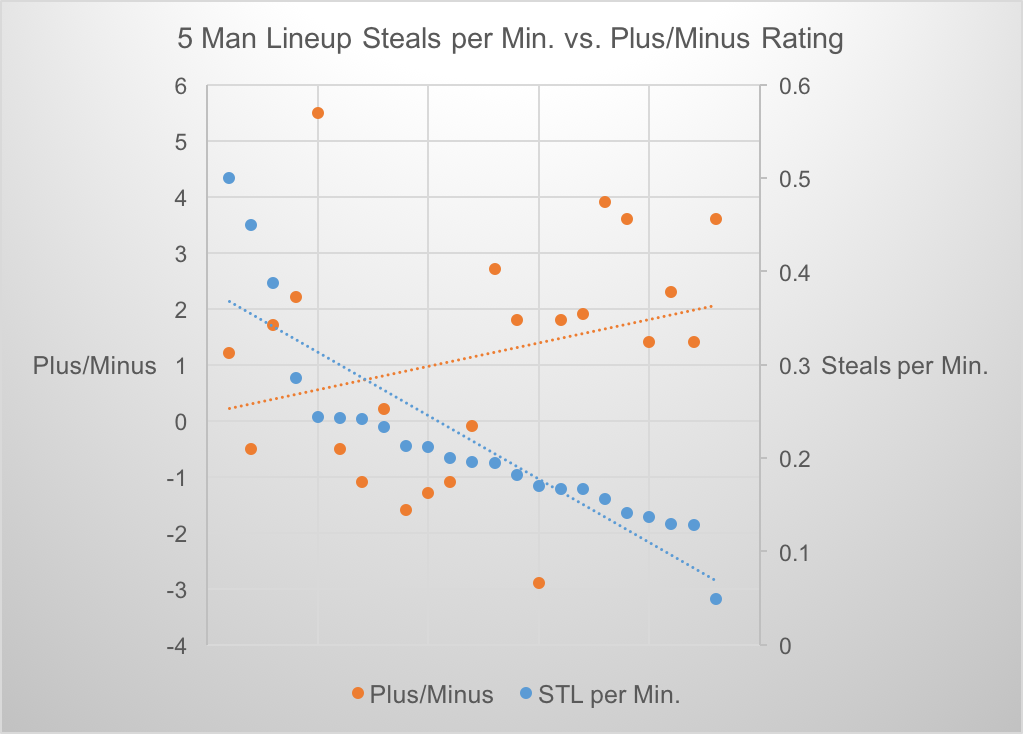
With the prospect lineup firmly at the top of the list, the next three all feature Ross and Patterson. This is an interesting one though – most of the team’s best lineups have a lower steal rate. The lesson appears to be that the more conservatively Toronto plays, the more success they’ll have.
Blocks
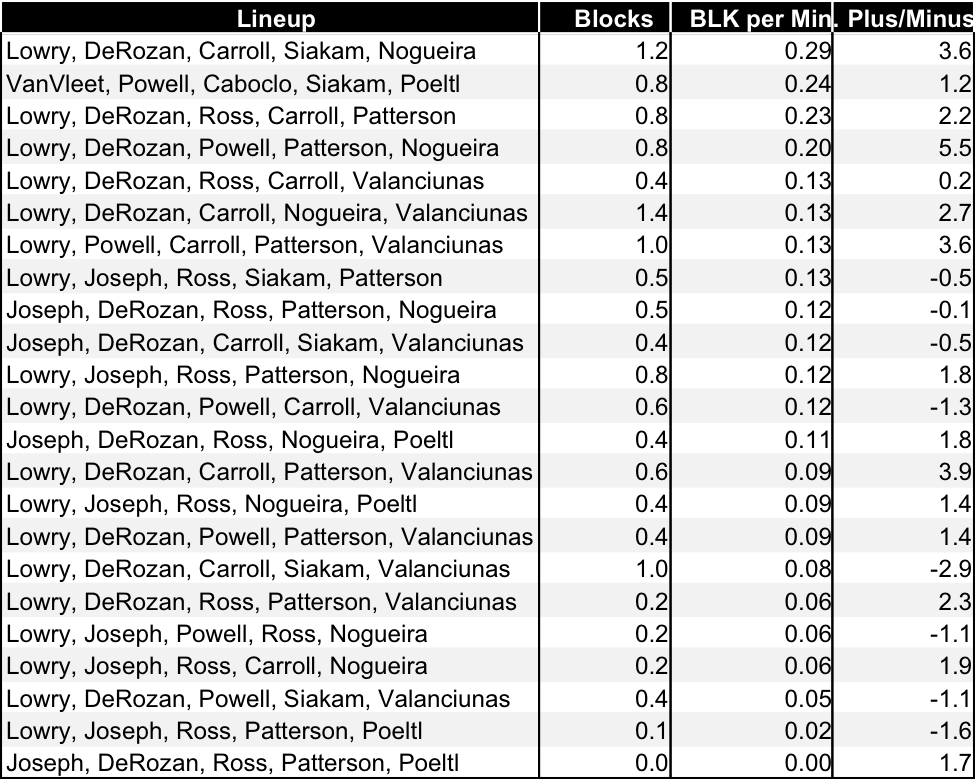
The correlation is back on this one – the more blocks per minute a lineup gets, the better the plus/minus, for the most part. Somewhat unexpectedly though, Lowry and DeRozan can be found in five of the team’s top 6 blocking lineups, while Nogueira (you know, the guy who actually blocks the shots) is only in 3 of those groups. The small-ball squad of Lowry-DeRozan-Ross-Carroll-Patterson is the most shocking, producing 0.23 blocks per minute played together, good for 3rd best.

Perhaps it’s the porous perimeter defense of the two All-stars that forces whoever is at the backline to make more block attempts? I’m not really sure what to make of this, except that blocks mean stops, and stops mean wins. Welcome, Serge Ibaka.
Turnovers
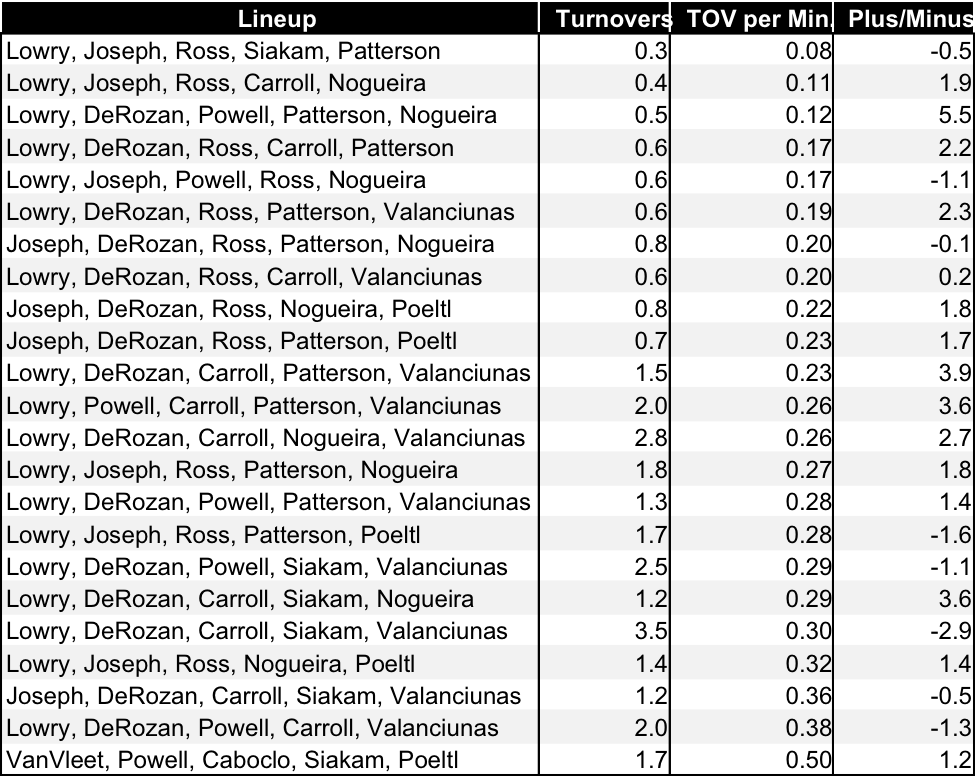

The Raptors have 3 lineups that turn the ball over at an extremely low rate, and Lowry is in all of them, while Joseph joins him in two of them. The graph seems to indicate common sense – for the most part, as the turnovers creep up, the plus/minus drops, and vice versa. Not much to report here.
Free Throw Attempts

DeRozan finds himself in each one of the team’s top 9 free throw attempting lineups, a staple of his game. Eight of those lineups have a positive plus/minus, which makes sense – when DeMar gets the calls, he often makes the shots and the Raptors get to set up on defense.
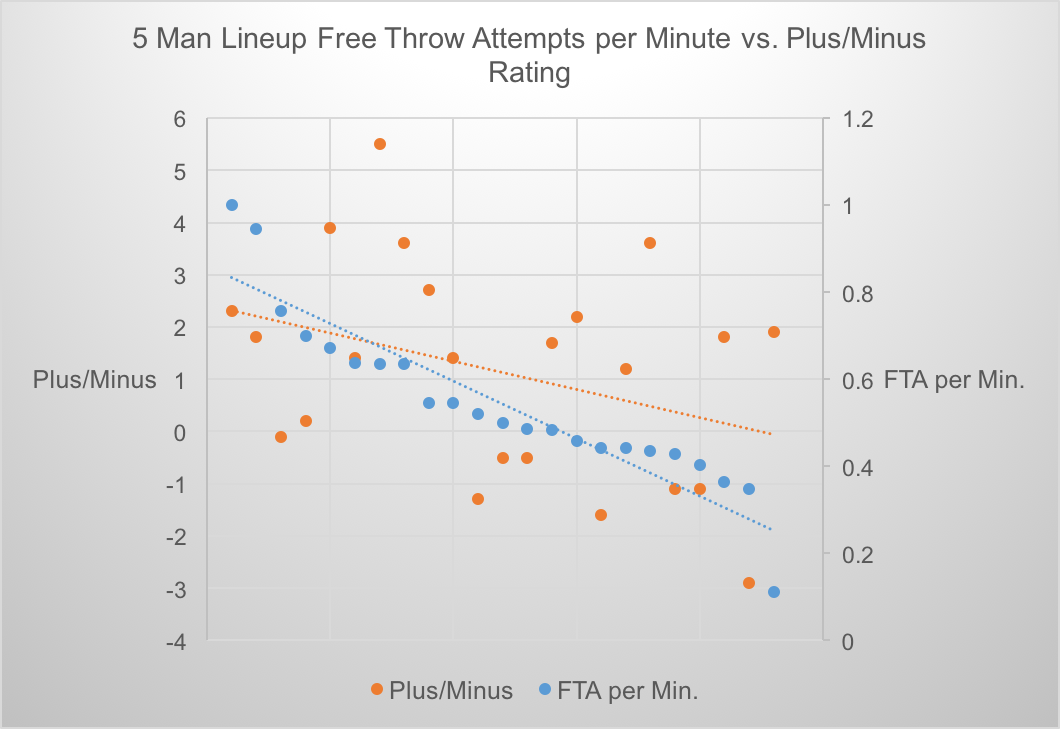
The graph supports the raw evidence, pointing to the uneasy fact that much of Toronto’s success hinges on trips to the charity stripe.
CONCLUSION
While Dwane Casey’s much maligned rotations have some room for improvement, the team should get markedly better with the addition of Ibaka and reintegration of Patterson, though Ross’ shooting prowess will be missed. What will the Raptors’ new extinction lineup be?