
It was an incredibly entertaining Toronto Raptors season. That much is obvious, considering they blew away expectations and made an improbable run to an Atlantic Division title, coming within a point of the second round of the playoffs (and oh, that still hurts, badly).
Prior to the season, I had theorized that the Raptors were likely to play in a lot of close games since they figured to be a middle-of-the-pack team. Here’s a snippet:
The logic is this: great teams should blowout bad teams, beat mediocre teams by less and show parity with other great teams. Bad teams should be blown out by great teams, lose by less to mediocre teams and show parity with other bad teams.
Mediocre teams, then, should play closer games with both great and bad teams and show parity against other mediocre teams.
This is basically the crux of Pythagorean Win Theory, whereby point differential is the best predictor of future performance. Consider the point differentials for different groups of teams based on win totals:
55+ 6.5 46-55 2.75 36-45 0.4 26-35 -3.2 26- -6.85 It turns out that the more mediocre the teams, the closer the point differential, which is what we would expect.
The leap of faith here is that a close total point differential also means close games. The results from 2012-13 aren’t dramatic, but let’s look at that table again and include the number of games each team had that finished within a five-point margin of victory or defeat:
Wins Point Diff Gms +/- 5 55+ 6.5 20.3 46-55 2.75 21 36-45 0.4 23.1 26-35 -3.2 21.9 26- -6.85 21 Again, it’s not extreme, but the best and worst teams seem to play about two fewer ‘close games’ than mid-level teams.
Basically, mid-level teams play in more close games. As it turned out, however, the Raptors were 48-34, not quite the middle of the pack, and had the number nine average margin of victory at 3.24 (17th in absolute terms).
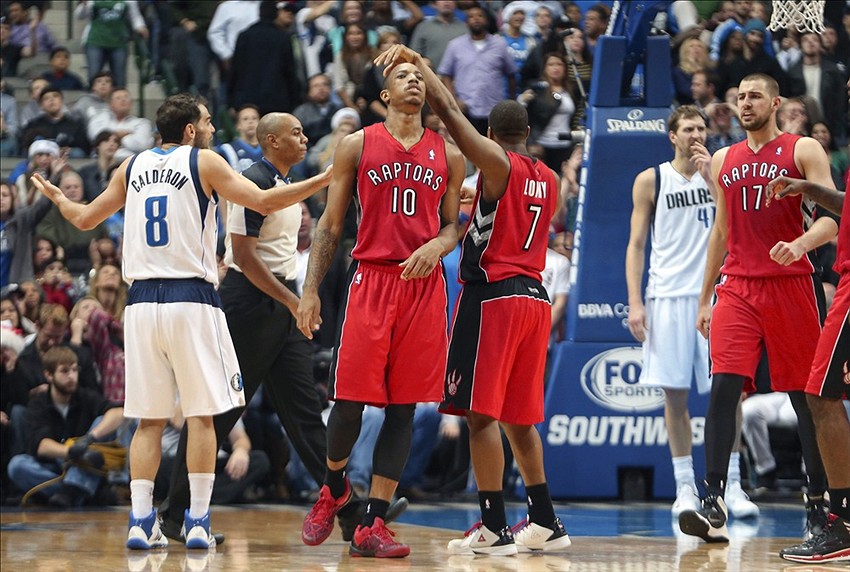
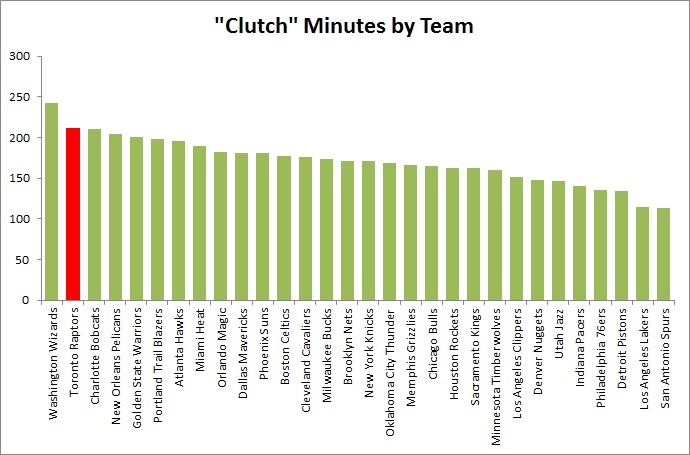
But still, thanks to some crazy fourth-quarter comebacks and a never-say-die, Undertaker-before-my-client-Brock-Lesnar-ended-the-streak-like ability to continue to fight back, the Raptors ended up playing more “clutch” minutes than almost any other team during the regular season.
Only the Washington Wizards, who played 242 minutes that qualified as “clutch time” (the game within five points in the last five minutes of the game), topped the Raptors’ mark of 212. What’s more, no team entered “clutch time” more often than the Raptors, who did so in 54 of their 82 games, four more occasions than any other team. Even leaving aside that the Raptors were generally terrific in the clutch (+8.2 points per 48 minutes), we were treated to more must-see basketball than maybe any other fanbase. Again, two-thirds of their games were within five points at some point in the final five minutes. MLSE owes us all some baby aspirin to help with our blood pressure.
| Team | GP | MIN | +/- | +/- per48 |
|---|---|---|---|---|
| Washington Wizards | 46 | 242 | -43 | -8.53 |
| Toronto Raptors | 54 | 212 | 36 | 8.15 |
| Charlotte Bobcats | 48 | 210 | 7 | 1.60 |
| New Orleans Pelicans | 50 | 204 | -11 | -2.59 |
| Golden State Warriors | 43 | 200 | 15 | 3.60 |
| Portland Trail Blazers | 47 | 198 | 87 | 21.09 |
| Atlanta Hawks | 49 | 196 | 11 | 2.69 |
| Miami Heat | 43 | 189 | 24 | 6.10 |
| Orlando Magic | 42 | 182 | -86 | -22.68 |
| Dallas Mavericks | 48 | 181 | 60 | 15.91 |
| Phoenix Suns | 50 | 181 | -7 | -1.86 |
| Boston Celtics | 49 | 177 | -98 | -26.58 |
| Cleveland Cavaliers | 42 | 176 | -3 | -0.82 |
| Milwaukee Bucks | 40 | 173 | -97 | -26.91 |
| Brooklyn Nets | 38 | 171 | 1 | 0.28 |
| New York Knicks | 39 | 171 | -22 | -6.18 |
| Oklahoma City Thunder | 43 | 168 | 9 | 2.57 |
| Memphis Grizzlies | 49 | 166 | 102 | 29.49 |
| Chicago Bulls | 37 | 165 | 46 | 13.38 |
| Houston Rockets | 42 | 162 | 62 | 18.37 |
| Sacramento Kings | 42 | 162 | -56 | -16.59 |
| Minnesota Timberwolves | 41 | 160 | -91 | -27.30 |
| Los Angeles Clippers | 43 | 151 | 58 | 18.44 |
| Denver Nuggets | 43 | 148 | -18 | -5.84 |
| Utah Jazz | 40 | 146 | -42 | -13.81 |
| Indiana Pacers | 37 | 140 | 52 | 17.83 |
| Philadelphia 76ers | 34 | 136 | -6 | -2.12 |
| Detroit Pistons | 39 | 134 | -32 | -11.46 |
| Los Angeles Lakers | 38 | 115 | -8 | -3.34 |
| San Antonio Spurs | 30 | 113 | 50 | 21.24 |
And, of course, the Raptors made the playoffs and had a very tight series with Brooklyn, one I can no longer bring myself to talk about.
That’s pretty cool. End of article. I made my point. We got lucky with some awesome basketball.
Of course, there are more ways we can show this and since it’s late May and why the hell not, let’s have a look.
As mentioned, the Raptors ranked 17th in absolute average game margin, meaning their average game was slightly closer than the median and average team but not appreciably so.
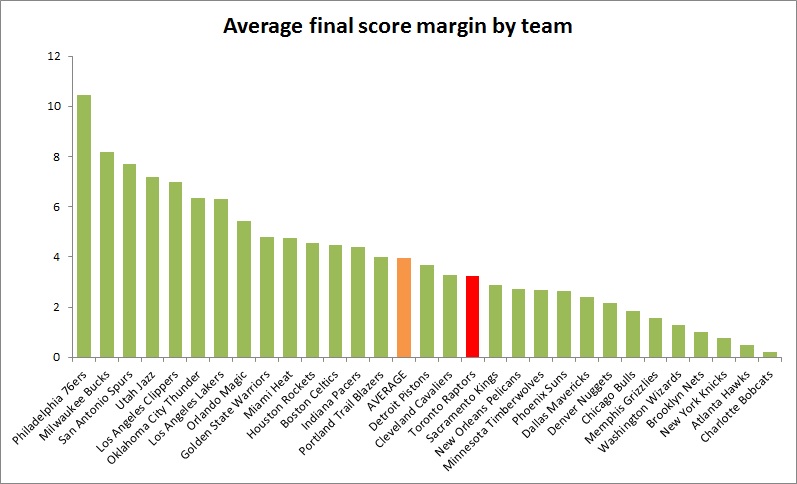
That tells us a bit but not a great deal. For example, the following outcomes could all get you roughly in the range that the Raptors shared with the Cleveland Cavaliers: 72 one-point games and 10 20-point games, or 24 four-point games and 58 three-point games, or 40 10-point games. Same average, far different story in terms of how entertaining the season was.
So, let’s instead look at the league’s spread of outcomes and compare it to the spread that the Raptors experienced.
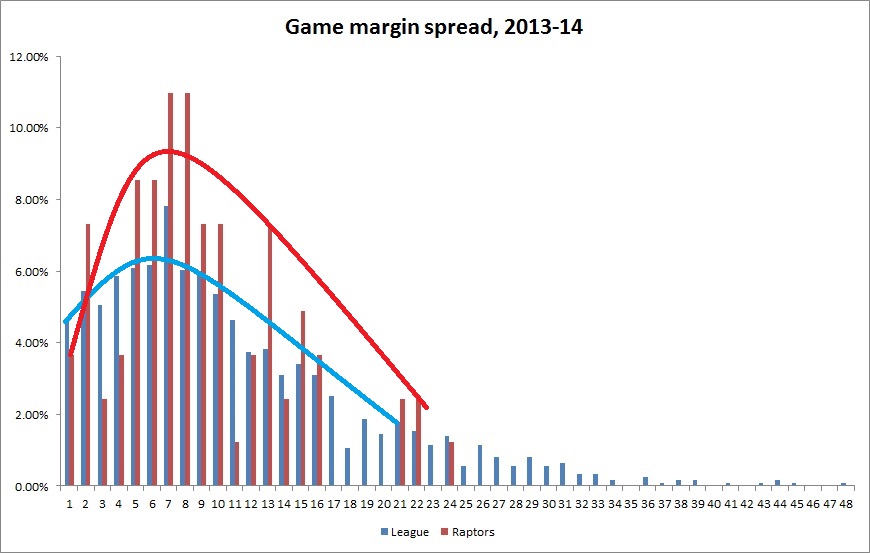
What this clearly shows is that the Raptors played a greater percentage of their games at lower margins than the league on average (though the curve lines have been drawn incredibly crudely and the tails don’t complete). For a better look, we’ll put the margins in bins rather than individual outcomes.
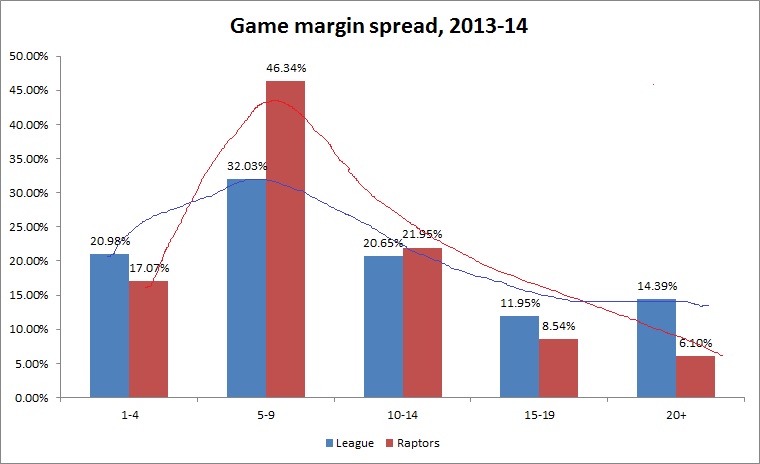
Just in case you had any modicum of respect left for my curve-drawing from above, I destroyed it here. However, what becomes clear from this more “zoomed in” look at the margin spreads is that the Raptors didn’t actually play a greater proportion of their games to a very narrow finish compared to league average, but it was their absence of blowouts that stood out. Nearly two-thirds of Toronto’s games finished with a single-digit margin, compared to just a hair over half of all games league-wide.
And just for further comparison, here’s the same graph but also including Charlotte and Philadelphia, the team’s with the league’s lowest and highest average game margins, respectively.
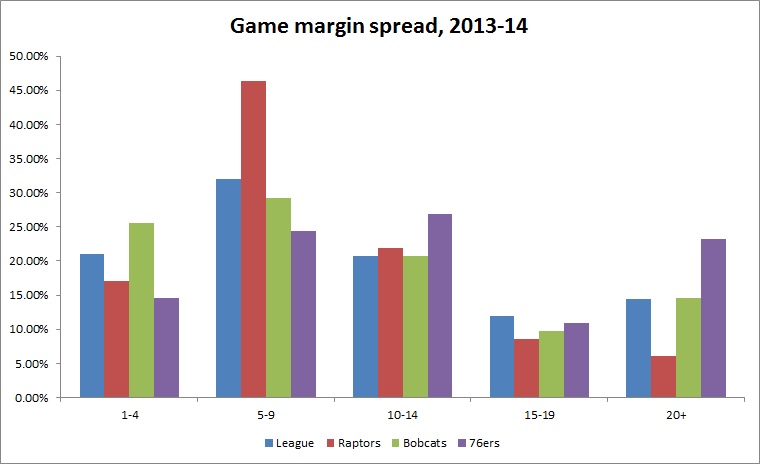
Again, it shows just how blowout-proof the Raptors were, ranking lower than even the Bobcats, who basically played their entire season to a draw, in blowout games.
So, hey, it wasn’t just fun for narrative purposes, we also happened to get generally more entertaining games than other teams. Hooray for graphs.