A quick one for a Monday – providing more support for phdsteve’s post on the weekend..
Ed Davis, PF, University of North Carolina
Comparison of his two college years
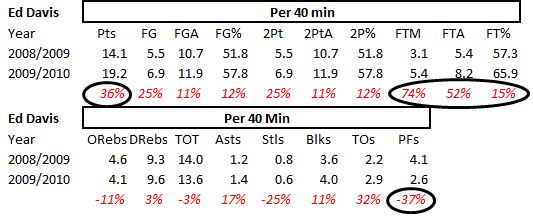
There is a fair bit of commentary about Davis’ poor second season. Some of it surely is more directed at North Carolina’s overall poor showing. I would think a team that lost Tyler Hansbrough, Ty Lawson, Wayne Ellington and Danny Green would regress. And with the loss of those players there should be less open looks (a combination of Hansbrough double teams and a great facilitator in Lawson), but a higher utilization. So what happened? I’ve pulled the data for his two years – on a “Per 40 Minute” basis for easy comparison.
As expected, his scoring went up. But it’s also interesting to see his FG% rise significantly – you would think he would have received much better looks the year before. He was got to the line much more often. The best stat is his personal foul rate – only 2.6 per 40 min. Outstanding given that he also recorded 4.0 blocks per 40. Besides being out with an injury, did he really have that worse a season?!
Against Aldrich and Patterson
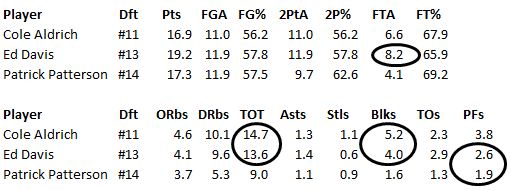
While I pegged Patrick Patterson to be my personal pick at #13, I certainly made the error believing Ed Davis would not be in the mix. So, how does Davis compare to the rest of the draft class and other two bigs we mentioned?
In the draft class
#3 in Def Rebounds (per 40) behind Aldrich and Cousins
#5 in Tot Rebounds (per 40)
#8 in FG%
Against Aldrich and Patterson?


His numbers stack up quite well against the two: Mr. Davis gets to the line more often, rebounds well and has the best block-to-PF ratio (1.54) of the three. We’ll take it.
Source: Most of the Per 40 min data as well as measurements are from draftexpress.com


