Stats, Eyes and Lies – revisited
The granddaddy of True Hoop, Henry Abbott, recently wrote
Since I first interviewed the brilliant Dan Rosenbaum… — the first time I encountered advanced stats — I always felt that the basketball world and all of its followers were on an inevitable path to embracing all of this and more. The information is simply so valuable; it’s the natural evolution of things.
And later in the article (emphasis added):
I know a number of stat experts who work for NBA teams. Many, but not all, live with the walking disappointment at how little their employers embrace, or even understand, what they’re saying.
My recommendation would be: Stop showing them spreadsheets. They’re never going to make big decisions that way. It’s not how most people think.
…
Use the stats and the spreadsheets more than ever, but behind-the-scenes, like plumbing — not as the final element in the presentation.
Bingo. A vocal few didn’t like my criticisms (see “Stats, Lies and Eyes“) of metrics like PER, Wins Produced and adjusted +/-. While I use them often, I also understand the limitations.
It’s this simple:
Advanced statistics have the ability to “see” every single possession – a GM/coach/scout/fan does not. Advanced statistics are emotionally unbiased – a GM/coach/scout/fan is not. Yet, a GM/coach/scout/fan can see that player X alters shots more often than others, forcing more misses – while most advanced metrics will only give credit to the rebounder of that shot and none to the defender. A GM/coach/scout/fan can see player Y setting hard picks which leads to clearer lanes to the basket – while most advanced metrics only give credit to player than made the basket.
The punchline: marry the two. You cannot make the best decisions without consulting both.
“I’m not smart enough to do the math.” – Jeff Van Gundy at MIT Sloan Sports Analytics Conference
If you have good tools, use them. You may have “good eyes”, but you will not see every play by every team for every game. And you may endorse a certain metric, but we also need to understand its limitations.
I love chatting with the Raptors journalists (some really great ones in this city), announcers and even occasionally team staff on this topic. As you can imagine, their views on advanced statistics vary from “it’s useless, I trust my eyes” to “I love the stuff”. When asked my view (they usually believe I’m very biased for obvious reasons), I sometimes surprise them when I say “I would never make any conclusions from just the numbers, but it many cases it helps you ask the right questions“. What do I mean? By way of example: “Why does player X have a higher Wins Produced and Advanced Statistical +/- then player Y” or “Why is this lineup better than that lineup where my intuition would conclude the opposite?”
The New New Things
The annual MIT Sloan Sports Analytics Conference was recently held in Boston. It is a great source of new ideas. One of my issues with the state of some commonly used metrics like PER and Wins Produced, is the authors spend more time criticizing each other rather than accept the challenges with their approaches and continuously improve upon them. Surely, in a complex game like basketball, a “single version of the truth” will elude us for quite some time. Thankfully, many continue to bring new ideas to fold.
RR Forum Super Moderator Matt52 recently noted the Toronto Raptors were one of the early teams who adopted STATS LLC’s optimal recognition cameras in their arenas. I had caught wind of it before the season started, but didn’t mention anything as it was still “early days” for the technology.
The optical camera recognition data has several potentially powerful applications. Last year when I attended the Sloan Sports Conference, I attended the “What Optical Tracking Data Says about NBA Field Goal Shooting” and came away impressed. These cameras (well, the data from them) can answer questions like “how wide open was player x?”. While video analysis can give coaches much of what they need via their “eyes”, its impossible to make the time available to answer this question for a large number of players in a season. You can see a defender isn’t closing out to the degree that he should, but to have the precise measurement of all close outs for a season is more powerful. Even more compelling is to analyze in what situations is he closing out better or worse. And then you head back to the video room.
The data can quickly help scout opponents and have the coaches focus their video analysis on key themes. [It also puts facts into the argument – such as Matt52 point out: Jose Calderon is “quicker-than-you-think“] This saves time and ultimately gives coaches more tools in order to make adjustments.
A worthy read which is on topic: “Can Basketball Reboot Its Box Score?” by the great Joe Treutlein from HoopData.com
“… basketball is a dynamic and fluid game with 11 constantly moving parts – 10 players and the ball. This often makes it difficult to quantify certain basic events on the court, and even harder to properly assign responsibility among the players.
How does one distinguish the weighting of value between the passer and scorer on assisted field goals? When Jason Kidd makes an unchallenged pass to Dirk Nowitzki shooting a contested, fade-away, mid-range jumper, but Steve Nash gets in the lane, draws a double team, and kicks it out to a wide open Jared Dudley in the corner, are both of those passes providing equal value? How about if only Dirk’s goes in – was Nash’s worth nothing?
Indeed, Oliver pointed to proper division of credit and blame being among the largest challenges facing the advancement of statistics in basketball, and said he’s actually spent some free time reading legal theory books trying to get a better handle on the issue.”
I have added the emphasis above. This was exactly the point I was trying to make in my initial “Stats, Eyes and Lies” post.
Another interesting paper that came out of Sloan this year was Kirk Goldsberry’s “CourtVision: New Visual and Spatial Analytics for the NBA” Why? Because it helps answer questions. For example, let’s look simply at Tyson Chandler’s league leading FG% and perhaps take my Wins Produced derived conclusion that this high percentage shooter should replace many of Carmelo Anthony’s shots. The data from Goldsberry’s paper notes that every player in the top 10 last year in FG% was either a forward or center. However, other factors are important (including the eFG% concept vs basic FG%) like Spread (total spatial spread of a player across all scoring cells) and Range (effective shooting range of player across all scoring cells). Why? Because if Tyson Chandler’s spread percentage is much lower than someone like Kobe Bryant or Ray Allen, a problem emerges. Its hopefully intuitive, but a coach cannot simply “take” shots from a low efficiency shooter like Carmelo Anthony and “give” them to Chandler if the vast majority of his shots are only a few feet from the baskets – several of which are put backs. The opposing coaches are all dim – they will adjust. Thus, spread and range are important concepts in efficient offenses – keeping defenses “honest” is key.
Local favourite Eric Koreen sums it all up well:

A New New Thing: Advanced Statistical Plus/Minus (ASPM)
With Bargnani out of the lineup so long and the overall lack of talent on the roster this year, it makes it more challenging for us to debate optimal lineups, minutes played etc. The Raptors are going to lose more often than not and no amount of tweaking (except for the obvious switch from Rasual Butler to James Johnson) will make a dramatic difference.
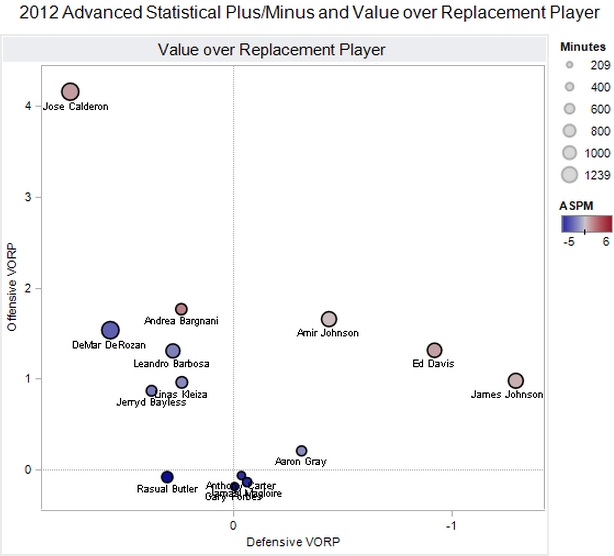
However, with the theme of “new new things”, I thought I’d highlight Advanced Statistical Plus/Minus. As I mentioned a few posts ago, the “Sport Skeptic” examined the predictive power of various “holy grail” metrics and ASPM came out on top (it also came out near the top for explanatory power).
The following shows the Raptors ASPM data and Value over Replacement Player:
Daniel, the author, explains the concept here.
The metric also seems to meet the “eye test”. Offensive star Jose Calderon shows as such, but also has a defensive liability. While James Johnson, who may not rate well on a PER or WP scale, rates highly here for his defensive ability.
Questions? There is a dedicated to “Statophile Q&A” forum thread here . If you prefer to send questions privately, you’re welcome to email me at tomliston [at] gmail [dot] com or find me on Twitter (@Liston).


